神经网络训练可视化
神经网络训练可视化
任务
上篇文章我们训练了一个三阶多项式,现在我们运用Matplotlib包将训练过程实时画出来。
复习一下,上篇文章我们训练三阶多项式的代码:
1
2
3
4
5
6
7
8
9
10
11
12
13
14
15
16
17
18
19
20
21
22
23
24
25
26
27
28
29
30
31
32
33
34
35
36
import torch
import math


class Polynomial3(torch.nn.Module):
    def __init__(self):
        super().__init__()
        self.a = torch.nn.Parameter(torch.randn(()))
        self.b = torch.nn.Parameter(torch.randn(()))
        self.c = torch.nn.Parameter(torch.randn(()))
        self.d = torch.nn.Parameter(torch.randn(()))

    def forward(self, x):
        return self.d + self.c * x + self.b * x ** 2 + self.a * x ** 3

    def string(self):
        return f'y = {self.d.item()} + {self.c.item()} x + {self.b.item()} x^2 + {self.a.item()} x^3'


x = torch.linspace(-math.pi, math.pi, 2000)
y = torch.sin(x)

model = Polynomial3()
criterion = torch.nn.MSELoss(reduction='sum')
optimizer = torch.optim.SGD(model.parameters(), lr=1e-6)

for t in range(2000):
    y_pred = model(x)
    loss = criterion(y_pred, y)
    if t % 100 == 0:
        print(t, loss.item())
    optimizer.zero_grad()
    loss.backward()
    optimizer.step()

print(f'Result: {model.string()}')
同时,我们也会使用到Matplotlib包的函数,可以看看之前的文章。
训练前
在训练前,我们要引入包并且做一些简单设置:
1
2
3
4
5
import matplotlib.pyplot as plt

plt.ion()
plt.xlim(-math.pi, math.pi)
plt.ylim(-1, 1)
简单来说,打开了交互模式,并且设置了坐标轴的显示范围。
训练中
我们之前只是每隔100次训练输出了一些简单的信息,现在我们加上画图:
1
2
3
4
5
6
    if t % 100 == 0:
        print(t, loss.item())
        plt.cla()
        plt.text(-3, 1, 't=%d, Loss=%.4f' % (t, loss.data.numpy()), fontdict={'size': 10, 'color': 'red'})
        plt.plot(x, y, x, y_pred.data.numpy())
        plt.pause(0.1)
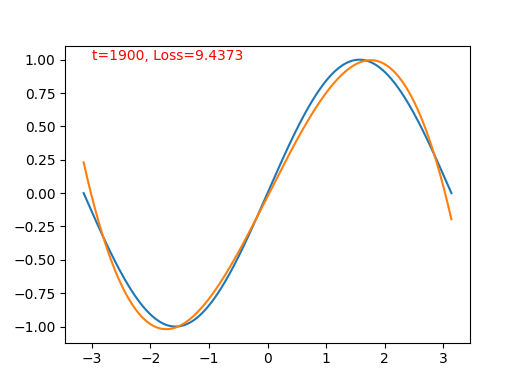
简单来说,在清空画板之后,我们在画板上标注了数据,并且画上了两条曲线,分别是$y$和$\hat{y}$
训练后
1
2
plt.ioff()
plt.show()
关闭交互模式。
组合到一起
以下为全部代码:
1
2
3
4
5
6
7
8
9
10
11
12
13
14
15
16
17
18
19
20
21
22
23
24
25
26
27
28
29
30
31
32
33
34
35
36
37
38
39
40
41
42
43
44
45
46
47
48
49
50
import torch
import math
import matplotlib.pyplot as plt


class Polynomial3(torch.nn.Module):
    def __init__(self):
        super().__init__()
        self.a = torch.nn.Parameter(torch.randn(()))
        self.b = torch.nn.Parameter(torch.randn(()))
        self.c = torch.nn.Parameter(torch.randn(()))
        self.d = torch.nn.Parameter(torch.randn(()))

    def forward(self, x):
        return self.d + self.c * x + self.b * x ** 2 + self.a * x ** 3

    def string(self):
        return f'y = {self.d.item()} + {self.c.item()} x + {self.b.item()} x^2 + {self.a.item()} x^3'


plt.ion()
plt.xlim(-math.pi, math.pi)
plt.ylim(-1, 1)

x = torch.linspace(-math.pi, math.pi, 2000)
y = torch.sin(x)

model = Polynomial3()
criterion = torch.nn.MSELoss(reduction='sum')
optimizer = torch.optim.SGD(model.parameters(), lr=1e-6)

for t in range(2000):
    y_pred = model(x)
    loss = criterion(y_pred, y)

    if t % 100 == 0:
        print(t, loss.item())
        plt.cla()
        plt.text(-3, 1, 't=%d, Loss=%.4f' % (t, loss.data.numpy()), fontdict={'size': 10, 'color': 'red'})
        plt.plot(x, y, x, y_pred.data.numpy())
        plt.pause(0.1)

    optimizer.zero_grad()
    loss.backward()
    optimizer.step()

print(f'Result: {model.string()}')

plt.ioff()
plt.show()
输出
如果你实际运行脚本,将得到一系列的动态图。
本文由作者按照 CC BY 4.0 进行授权
